- Category
- BI and decision intelligence
- Model
- open, installed on your premises
- Data
- never leaves
- Subscription
- €0 per month
Preparing a weekly or monthly report takes an average of 4–8 hours: data extraction, formatting, writing commentary, updating charts. The Automatic Reporting Agent connects your data sources, generates the complete report in PowerPoint or PDF format and sends it by email to the right people, every week or month, with zero human intervention.
Manual reports are time-consuming, often late and not always reliable. Each team member produces their own report with their own metrics. Management receives conflicting information. And time spent on reporting is time stolen from analysis and decision-making.
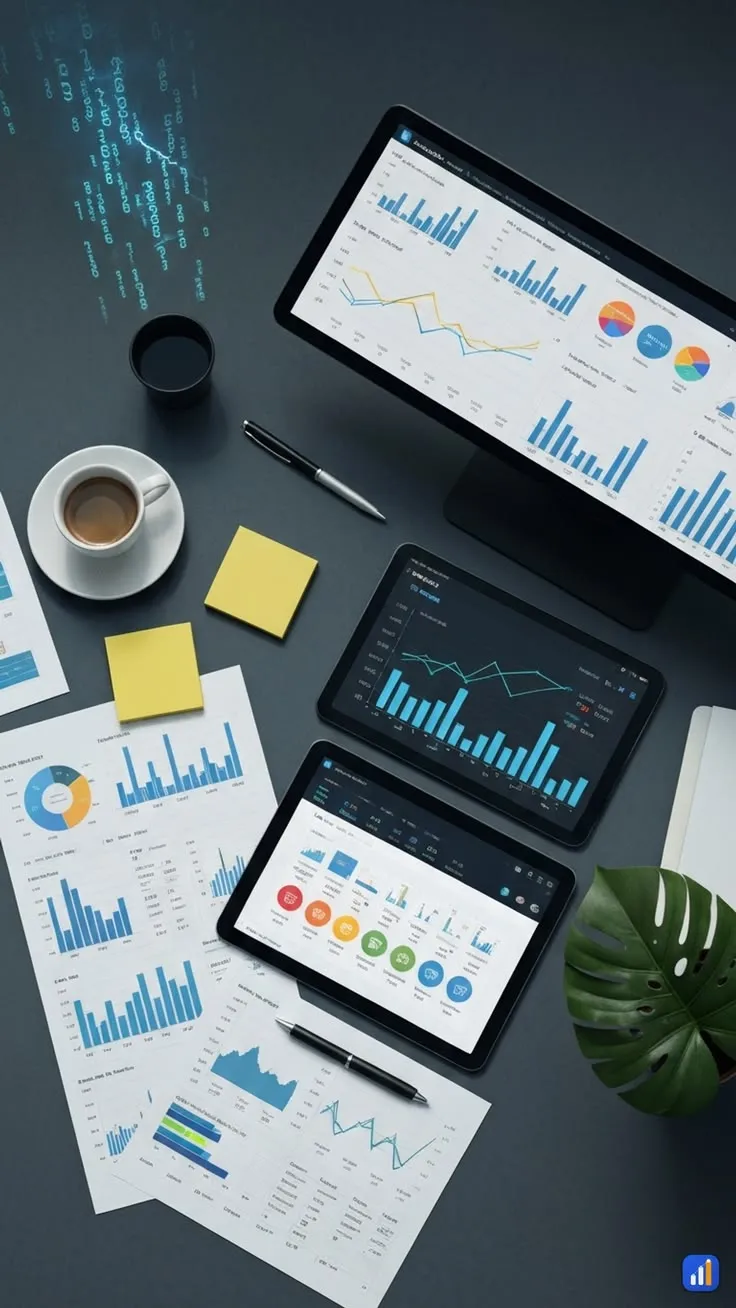
The agent connects to your sources (WooCommerce, Shopify, BigQuery, Google Analytics, Facebook Ads, CRM) and automatically generates a structured report based on your template. Each chart is LLM-commented (trend interpretation, anomaly alerts, recommendations). The PDF or PowerPoint is emailed to stakeholders on your schedule.
Live in four steps.
- 01Data source audit
Identification of all your sources: e-commerce, CRM, ads, analytics. Connection via API or automatic export.
- 02Report template definition
Design or integration of your existing template. Definition of metrics, charts and sections per report.
- 03LLM commentary calibration
Configuration of automatic commentary rules: alert thresholds, phrasing, tone adapted to your audience.
- 04Scheduling & distribution
Send schedule configuration (daily, weekly, monthly) and recipient list per report.
Results you can measure.
Complete report generation takes under 5 minutes. Your teams recover several work days per month.
The report uses real-time data from your sources. No risk of analyzing stale figures.
Every chart comes with an LLM interpretation: trend, detected anomaly, context and recommendation.
What we get asked before signing.
Which data sources are supported?
Can the template include our logo and brand?
Can we have multiple reports with different audiences?
Can external data (sector benchmarks) be added?
Let's talk about your case for thirty minutes.
A conversation to understand your context, volumes and tools. You leave with a scope and an order of magnitude, no commitment.