Forecasting & Anomaly Detection
Anticipate trends and catch drifts before they impact your business
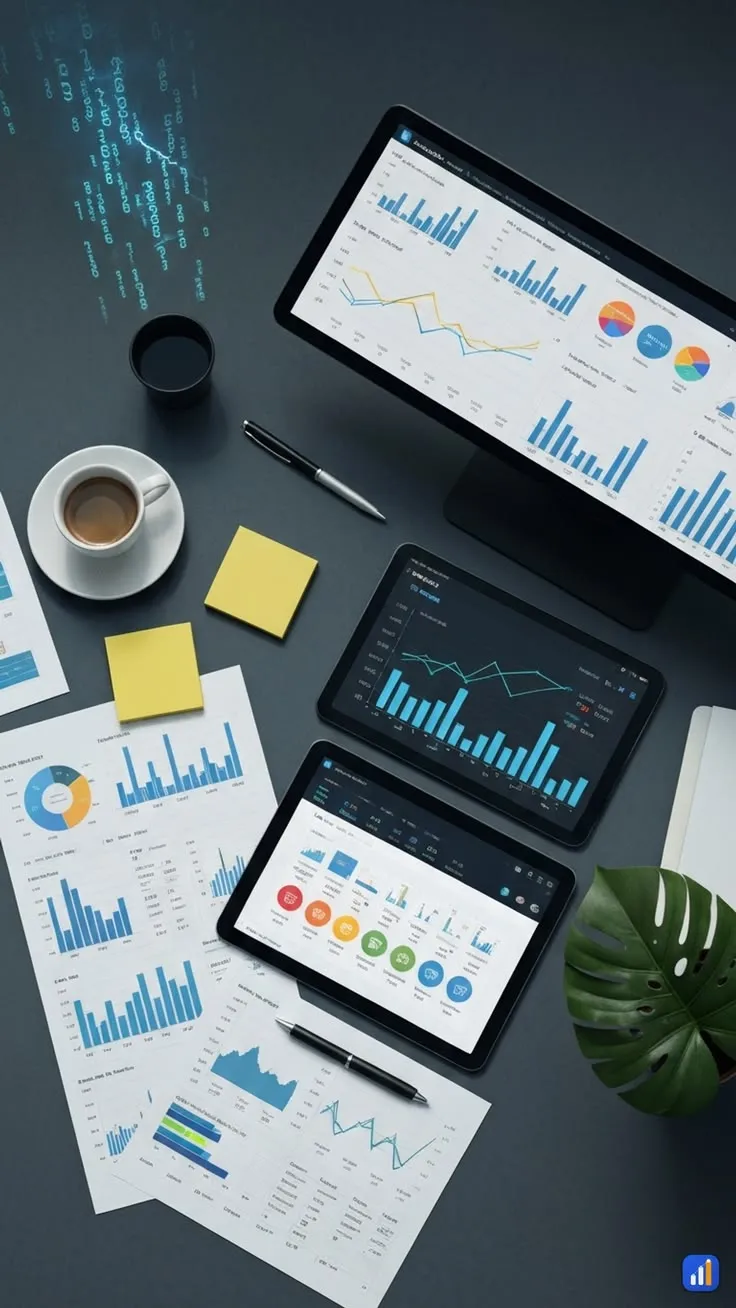
- Category
- BI and decision intelligence
- Model
- open, installed on your premises
- Data
- never leaves
- Subscription
- €0 per month
Running a business without reliable forecasts is like driving with only a rearview mirror. Dashboards show you what happened, not what will happen. The Forecasting & Anomaly Detection agent trains prediction models on your historical data, generates 3, 6 and 12-month projections and detects anomalies in real time that signal a problem before it shows up in your KPIs.
Manual forecasts rely on intuition and past trends. Anomalies are detected late, when monthly numbers are already in the red. Without proactive alerts, operational problems (churn, conversion drop, cost drift) stay invisible until they become critical.
Machine learning models (Prophet, ARIMA, XGBoost) are trained on your historical data (sales, traffic, costs, retention). Forecasts are updated weekly with confidence intervals. Each detected anomaly (abnormal peak or trough vs. forecast) triggers a Slack or email alert with a natural-language explanation.
Live in four steps.
- 01Historical data collection & cleaning
Extraction of 12–36 months of data from your sources (CRM, e-commerce, analytics). Cleaning and normalization.
- 02Model training
Selection and training of the best algorithms for your time series. Validation on holdout data.
- 03Real-time alert deployment
Connection to real-time data feeds. Anomaly thresholds configured to your critical metrics.
- 04Forecast dashboard & monitoring
Forecast visualization interface, alert history and continuous model accuracy score.
Results you can measure.
Our models average 92% accuracy on the first 30 days of forecast, depending on historical data quality.
Drifts are flagged before they appear in monthly KPIs. You intervene while there's still time.
Cost and revenue forecasts let you adjust resources in advance. No more end-of-month surprises.
What we get asked before signing.
How much historical data is needed?
Are models retrained automatically?
Can multiple metrics be forecasted simultaneously?
Are alerts customizable?
Let's talk about your case for thirty minutes.
A conversation to understand your context, volumes and tools. You leave with a scope and an order of magnitude, no commitment.